

Directors and managers in the non-profit and for-purpose sectors generally like to think of themselves as rational (evidence-based) decision-makers. As in most fields however, decision quality is often compromised due to unconscious (cognitive) biases, and other factors.
Evidence and decision quality
Data quality is a key determinant of evidence quality. In turn, evidence quality is a key determinant (amongst others) of decision quality. Consequently, data quality is a concern for directors and managers, not just for IT and research staff.
The chart below highlights the significance of data quality and integrity in the deliberative processes used by governing boards. Under the MELD reflective governance model, this concern for data quality is ‘located’ in the quadrant from measuring to evaluating, as directors move through analysis to synthesis – as a basis for then making decisions (directing).

Three key aspects of data quality, comprising the data quality triangle, are generally considered the most important for the effectiveness of monitoring and evaluation activities undertaken by governing boards. These focus attention on data validity, reliability and timeliness, as outlined in the chart which follows. See also the links to previous posts on monitoring and evaluation listed below.

Dirty data is only one of the factors which can impair decision quality, and some additional examples and the outcomes they cause are suggested in the following chart and the accompanying quote from Mark Twain – which is as true today as it was in the 1800s.


Data quality dimensions are expressed in different ways depending on the context in which the data is being used. Academic and research quality dimensions are somewhat more esoteric than those used by most directors and managers. This can be seen in the reference chart below, which lists 18 different data quality dimensions, with some of those comprised of additional sub-categories.

Rational or ‘intuitive’ decision making
Herbert Simon (1977) noted that while the “classical theory of omniscient rationality is strikingly simple and beautiful”, the reality was that people had neither the energy nor the resources to optimise their choices. Instead, people aimed to make reasonable decisions by limiting their choices to a small set of alternatives, and by “satisficing” – i.e. choosing an option that is good enough as opposed to optimal. (Perhaps they had noted Voltaire’s observation that ‘the best is the enemy of the good‘. See this and other ‘quality’ quotes below). (See also Simon, H. A. (1979). Rational Decision Making in Business Organizations. The American Economic Review, 69(4), 493–513. http://www.jstor.org/stable/1808698)

Nobel Laureate in Economics Daniel Kahneman and his colleague Amos Tversky, famously identified two kinds of thinking – fast (intuitive) and slow (rational).
Their 1974 paper Judgement Under Uncertainty: Heuristics and Biases provided examples of psychological experiments where classical utility theory broke down. Their 1979 follow-up, Prospect Theory: An Analysis of Decision Under Risk, went beyond this by providing a mathematical model of decision-making that accounted for biases such as loss aversion or uncertainty avoidance.
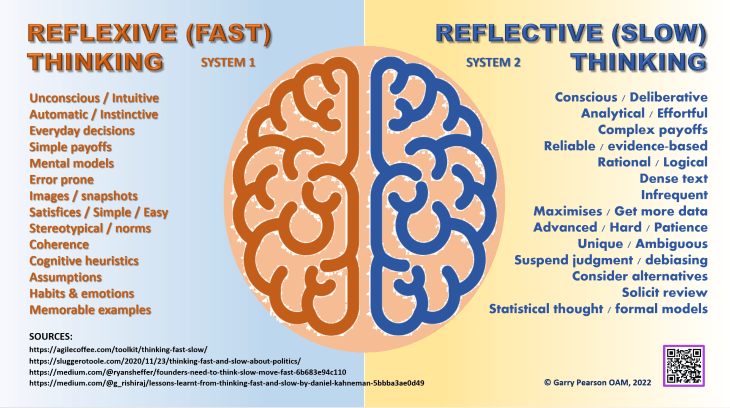
This capacity to be more risk-averse and so to baulk at proposed changes, even when compelling supporting data (presumably cleaned and reliable data) and arguments are available, often frustrates managers and directors serving non-profit communities. These behaviours are only two of a wide range of factors which can impair the quality of decisions. A list of some of these factors is provided in the chart below.

Data integrity
Bringing objectivity to bear on data and analyses, and being alert to various cognitive biases, are both necessary for evidence-based decision-making. So too is an awareness of the ways in which data quality may have been compromised, with the potential to impair the quality of decisions based on those inputs.
Data governance is generally considered a specialist IT function, with some aspects being somewhat too technical for most board directors. Nonetheless, directors do need to consider the integrity of the data on which they rely for governance decisions, and which underpins their organisation’s service delivery.
You don’t need an IT degree to recognise that the seven major types of dirty data listed in the chart below are likely to compromise your decision quality. Directors are therefore entitled to seek confirmation from management and IT support personnel that effective systems are in place to prevent these data quality problems and their consequences.

For those wanting a more detailed listing of the many types of dirty data that could plague your databases, you may wish to check out Kim, Won & Choi, Byoung-Ju & Hong, Eui & Kim, Soo-Kyung & Lee, Doheon. (2003). A Taxonomy of Dirty Data. Data Min. Knowl. Discov.. 7. 81-99. 10.1023/A:1021564703268.
While this analysis is about 20 years old, it remains a useful outline of the key reasons you might need to clean your data, and ‘assure’ its quality. An extract from their paper appears in the chart below. A Rule Based Taxonomy of Dirty Data (2011) offers an alternative analysis for those who are interested.

IT Governance
Cybersecurity risks have become ‘front of mind’ for most organisations in recent years, and they now comprise a key dimension of non-profit risk management plans. While data breaches are certainly high impact if they occur, they may not be as prevalent as dirty data risks. Arguably the impact of data breaches or ransomware would be greater, but the pervasive erosion of effectiveness caused by dirty data also warrants board attention.
Key resources to help directors perform their IT governance responsibilities are offered by:
- AICD – see A Director’s Guide to Governing Information technology and Cybersecurity
- The Australian Cybersecurity Centre
- The International Standards Organisation – ISO 38500:2015 Information Technology — Governance of IT for the organization
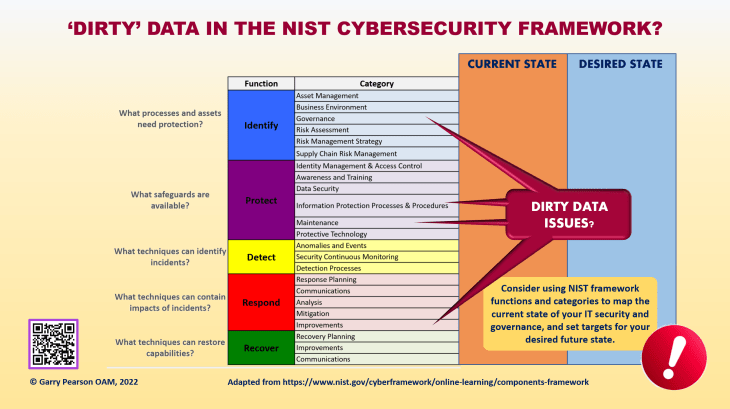
The US National Institute of Standards and Technology (NIST) offers a cybersecurity framework which you may find helpful in defining areas for attention, both for routine monitoring (risk management) and for planning purposes. The chart below was adapted from their framework to indicate some of the areas in which ‘dirty’ data might be an issue, but also to suggest the mapping of current and desired future states.
Your IT governance system
Data (and evidence) quality are dimensions worthy of inclusion in your organisation’s monitoring and evaluation framework and your IT governance systems. Apart from their impact on cybersecurity, operational efficiency and effectiveness, they are also key factors in the quality of decisions made by your board and senior management.
See also:
https://polgovpro.blog/2022/03/04/measuring-nfp-measures/
https://polgovpro.blog/2022/01/14/locus-focus-vs-hocus-pocus/
https://polgovpro.blog/2021/11/24/are-we-there-yet-evaluating-nfp-ouputs-outtakes-outcomes-impact/
https://polgovpro.blog/2022/01/21/reflective-governance-the-meld-model/
https://polgovpro.blog/2018/01/24/cyber-risk-in-your-governance-framework-part-1/
https://polgovpro.blog/2018/02/07/it-governance-and-cyber-risk-in-your-governance-framework-part-2/
2 thoughts on “‘Dirty’ data in – ‘Dirty’ decisions out”