

Red Flag Memes
Last year red flag emojis became something of a meme on social media. While red flag warnings were used most frequently in posts about personal relationships, they were also used in posts on political, sports, and business matters, amongst others. While it may be stating the obvious to observe that red flag emojis do not imply an objective risk assessment, regrettably, many seem to place great store in social media critiques.
A credit and risk advisory firm in the UK assigns Gold, Silver, and Bronze ratings to companies that are healthy, signifying that there is little risk associated with these businesses. As risk increases however, companies are given a rating of one, two, or three red flags. The total scale therefore comprises six basic levels. While these ratings may not be as ‘loose’ as red flag emojis, they should invite more due diligence and closer scrutiny.
Given the importance of weighing evidence when making significant business decisions, reference to ‘basic’ rating scales should be seen as only the first phase of more detailed analysis and active risk management.
Provisional risk ratings
In recent discussions with a client about negotiations they were engaged in, we identified a number of ‘red flags’ about the other party. The warning signs we identified differed somewhat in their nature and seriousness. While under other circumstances, a ‘quick and dirty‘ decision could be made to withdraw, we acknowledged that there may be various unknown factors at play, which could change our view regarding the likelihood and severity of the impact of each issue.

Taking that into account, our provisional risk rating could change after further due diligence, responses to enquiries, or new interactions with the other party.
My client was keen to pursue the relationship rather than walk away. Our discussion therefore focussed on how best to clarify or resolve the outstanding matters, and move forward to a more satisfactory assessment of the benefit/risk ratio. So, the decision to agree or decline the relationship was reserved, pending further dialogue or discovery.
Risk ratings can and should change as more is known about a situation. Risk levels are usually ‘assessed’ (rated) using an impact and likelihood matrix or ‘heatmap’. This approach recognises that each of the impact (severity, consequences) and likelihood (probability) ratings can vary up or down. Consequently, the overall risk rating will shift as the updated assessment is confirmed.
The illusions of objectivity and control
Critics of risk matrices argue that they are not objective tools, and that they give an illusion of control which may prevent key players from more actively managing risks in their environment. The quotes highlighted in the chart below are representative of such criticisms.

Doubtless these criticisms have some merit, but regrettably, they do not help smaller nonprofit organisations to address risk assessment with alternative tools. For example, risk bow-ties and scoring against criteria specific to the nature of the risk, are potentially useful when establishing prevention and response measures. They may not be suitable, however, for directors prioritising organisational risks at board meetings. It is likely that there would be limited time available to consider the level of detail and interpretation involved in those approaches.
Risk matrices therefore remain useful for the initial assessment and prioritisation of risks. Hopefully when we use these tools we also recognise that they are not much more objective than an emoji. They offer indicative ratings which help us to take more or less defensive postures according to the level of trust (another subjective measure) in the people, systems, processes, and/or technology involved.
Similar to the ‘bank of goodwill‘ concept, when we see red flags, or red and amber fields in a risk matrix, suggesting that behaviours or developments don’t match our expectations, the effect is that of a withdrawal from the trust credit balance (also known as the ‘thickness of trust’) we notionally attach to the other party.
Once priority risks have been identified, the development and implementation of preventive (control) and mitigation (response) measures for each is where the real work begins. Most of that work will be done by your nonprofit staff, but your Risk Committee will have an oversight role so that the board remains briefed on the systems of control being implemented.
Aggregate risks
Another observation arising from the abovementioned discussion with my client was that while each of the red flags we had identified would need to be separately rated (as per the matrix charts below), there was also a case for synthesising (integrating) our analyses, so that an overall risk assessment could be determined.
When your risk inventory is being updated, you will doubtless complete a risk matrix for each of the hazards you have identified in your environment, and this will have been considered alongside your risk appetite and risk tolerance when making decisions about whether or not to proceed with various strategic and operational initiatives. Where you have a complex project which involves multiple risk dimensions, your board will benefit from the development of an aggregate risk assessment that helps them to decide whether the project can or should be supported.
Your risk committee may also find that new insights are offered by determining the aggregate risk profile of your organisation, once all priority risks have been included in your updated risk inventory. The aggregate rating of all key risks may create more exposure than the board’s appetite will allow.
Simple scoring systems
Whereas large commercial or industrial organisations will employ more sophisticated multi-factor modelling and decision tools to calibrate risks separately and collectively, nonprofits rarely have the resources required for that level of analysis. Consequently, a simple scoring system can be helpful – at least as a way of prioritising the areas in which appropriate control and response measures need to be developed.
Risk matrices and scoring approaches vary in size and complexity, with the simplest being a 3X3 matrix (High, Medium, and Low rating levels for each of Likelihood and Impact). Other formats allow more levels to be added to either or both axes to create 3×4, 4×4, 4×5, 5×5, (etc.) matrices. Selected examples of three matrix formats with various methods of labelling and scoring are illustrated below for your reference.
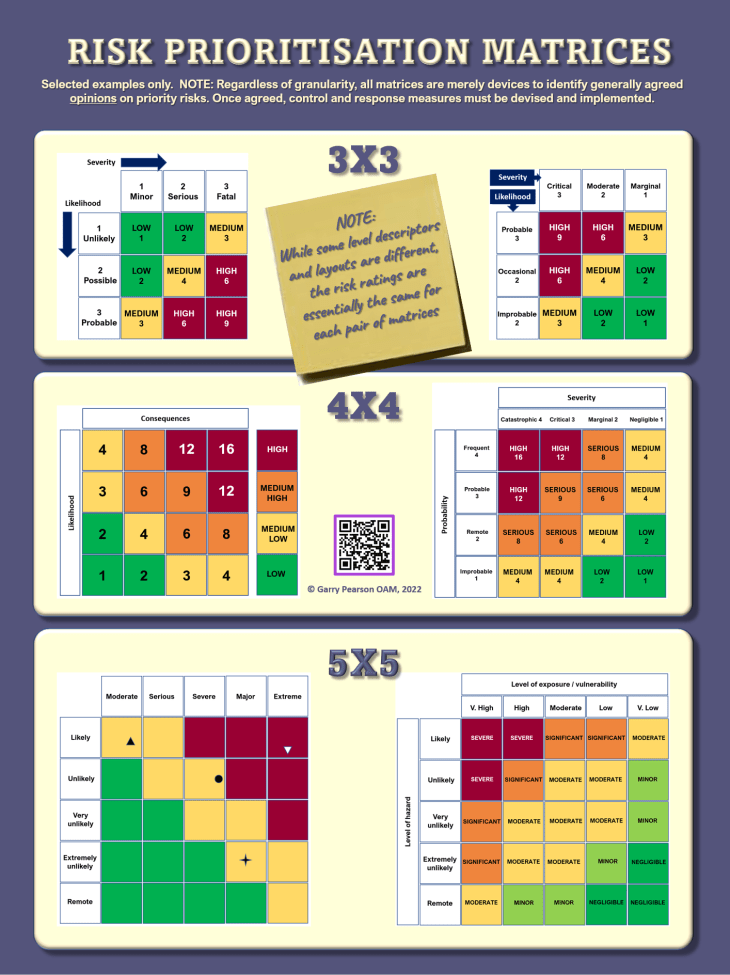
Nonprofit directors and managers may be comfortable using risk matrices to perform initial risk assessment and prioritisation, but hopefully, they will recognise that such tools are essentially subjective. More detailed analysis will need to occur when prevention and response measures are developed for each of the critical risks in your organisation’s risk inventory.
See also: